


TL;DR
This paper introduces Partial Least Squares (PLS) as a robust, distribution-free "soft modeling" approach for building path models with latent variables. It is specifically designed for complex, multidisciplinary research where theoretical knowledge is scarce, allowing researchers to estimate relationships between unobservable concepts using blocks of manifest indicators without requiring strict distributional assumptions.
What Problem Does This Paper Address?
Traditional econometric tools often require a "heroic" level of prior knowledge: researchers must know the exact relevant variables, their functional forms, and the underlying statistical distributions of the data. However, in many fields—such as sociology, political science, or early-stage economic research—theories are "rudimentary."
Investigators might only have a list of potential causal variables and a general idea of how they relate. Furthermore, the variables of actual interest (e.g., "social mobility" or "political stability") are often latent variables—concepts that cannot be observed directly and must be inferred from multiple "indicator" or "marker" variables. Herman Wold proposes PLS as a flexible alternative that bridges the gap between these "soft" theories and rigorous empirical analysis.
Methods
The core of the PLS approach is the construction of a path model consisting of two parts:
- The Inner Relations: A causal chain system that defines the relationships between different latent variables (LVs).
- The Block Structure (Outer Relations): The relationships between each latent variable and its set of manifest indicators.
The PLS algorithm is an iterative, multi-stage procedure:
- Stage 1: It estimates the latent variables as weighted aggregates of their indicators. The researcher chooses between Mode A (simple OLS, where indicators are treated as effects of the LV) and Mode B (multiple OLS, where indicators are treated as causes of the LV).
- Stage 2: Once the LVs are estimated, the model uses standard OLS regressions to determine the "loadings" (links between LVs and indicators) and the "path coefficients" (links between the LVs themselves).
- Stage 3: Location parameters (means) are estimated.
Unlike Maximum Likelihood (ML) methods, PLS is distribution-free. It doesn't assume normal distributions and relies on the "predictor specification" (minimizing residual variance) rather than maximizing a likelihood function.
Datasets
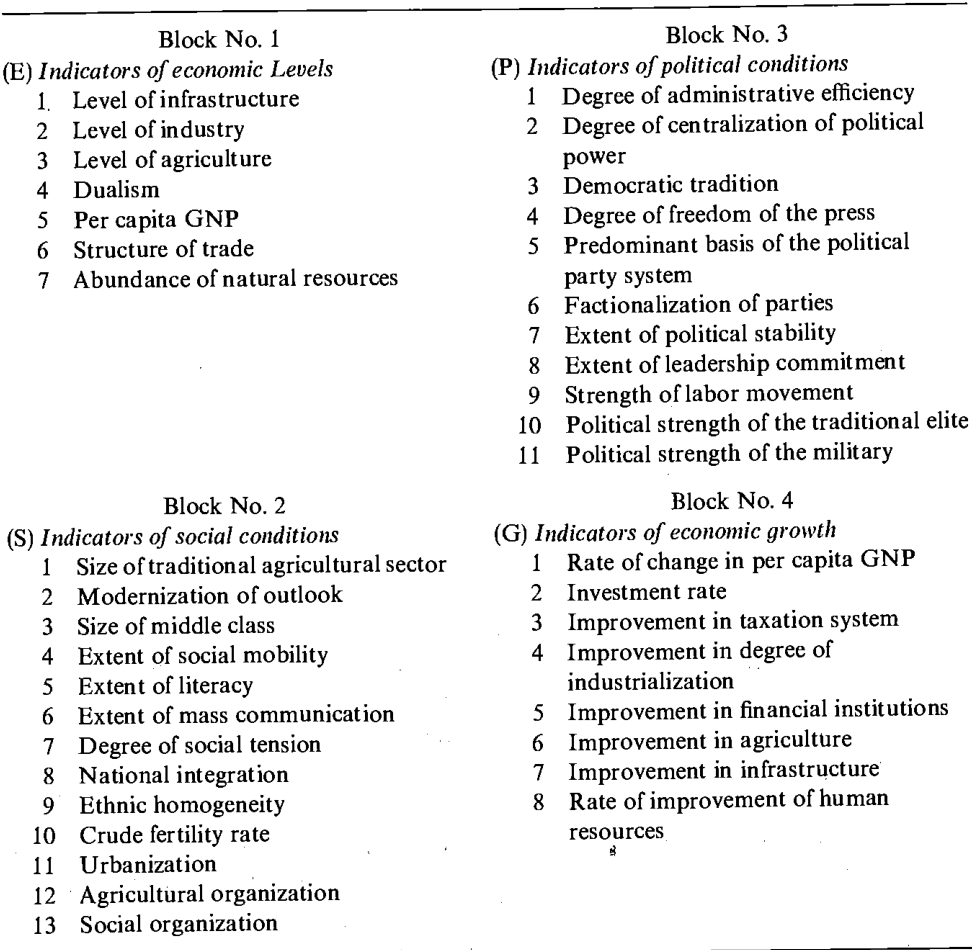
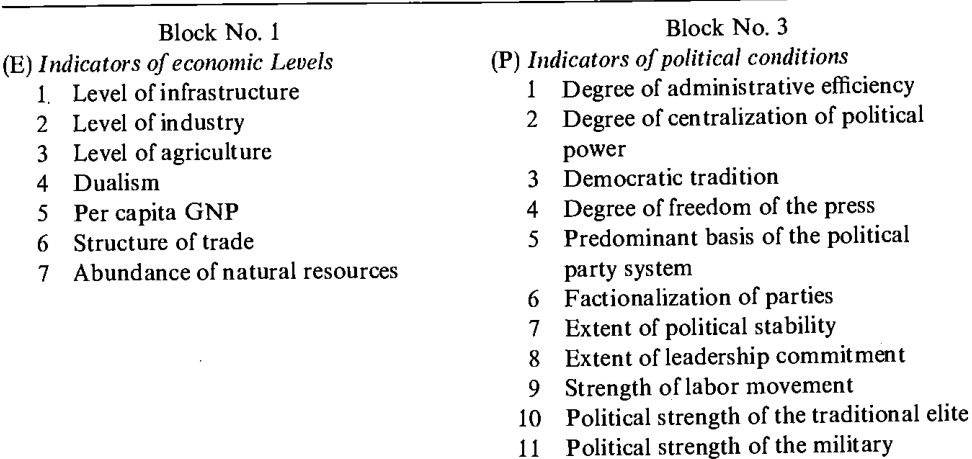
The paper illustrates PLS using a landmark study by Adelman & Morriss (1967, 1973) on the causes of economic growth in 74 non-communist developing countries. The dataset includes 41 indicators grouped into four blocks:
- Block 1 (Economic Levels): 7 indicators including Per capita GNP and abundance of natural resources.
- Block 2 (Social Conditions): 13 indicators such as literacy, urbanization, and social mobility.
- Block 3 (Political Conditions): 11 indicators including political stability and freedom of the press.
- Block 4 (Economic Growth): 8 indicators like investment rate and change in per capita GNP.
Key Insights and Ideas
- The Arrow Scheme as Theory: In PLS, the diagram of arrows is the theoretical specification. It represents the researcher's "rudimentary" knowledge and intuition about the system.
- "Soft" vs. "Hard" Modeling: Wold distinguishes PLS as "soft modeling" because it is deliberately approximate and flexible, whereas ML is "hard modeling" requiring rigid assumptions for optimal accuracy.
- Consistency at Large: A unique property of PLS is that as the number of indicators in a block increases, the estimation of the latent variable becomes more accurate (a result of the Law of Large Numbers).
- Flexibility in Estimation: Researchers can mix modes (Mode C) within a single model—for example, using Mode B for exogenous (input) blocks and Mode A for endogenous (output) blocks to balance different optimization criteria.
Key Results
Using the Adelman model, Wold demonstrates that PLS can quantify complex multidisciplinary relationships.
- Causal Links: The model shows that social and economic levels strongly influence political conditions, and all three blocks combined serve as predictors for economic growth rates.
- Robustness: The paper compares different estimation modes (A, B, and C) and finds that while results vary slightly, the core relationships remain stable. For instance, the correlation between Social Conditions and Economic Levels was consistently high (around 0.91-0.93) across all modes.
- Non-linearity: By splitting the 74 countries into subgroups (low, sporadic, and high growth), the author shows that the "inner relations" change significantly. For example, the impact of economic levels on political conditions is much stronger in high-growth countries than in low-growth ones.
Limitations and Future Work
- Small Sample Bias: While PLS is consistent (it converges to the true value as sample size increases), it is not necessarily unbiased in small samples.
- Evolutionary Nature: Model construction in PLS is intended to be an iterative, evolutionary process. Researchers are encouraged to start with a "generous" number of indicators and prune them based on empirical results.
- Software Integration: At the time of writing, the author noted that PLS was being integrated into statistical packages like MIDAS and MINITAB, and combined with other algorithms (like Fix-Point) to handle even more complex interdependent systems.
Summary updated